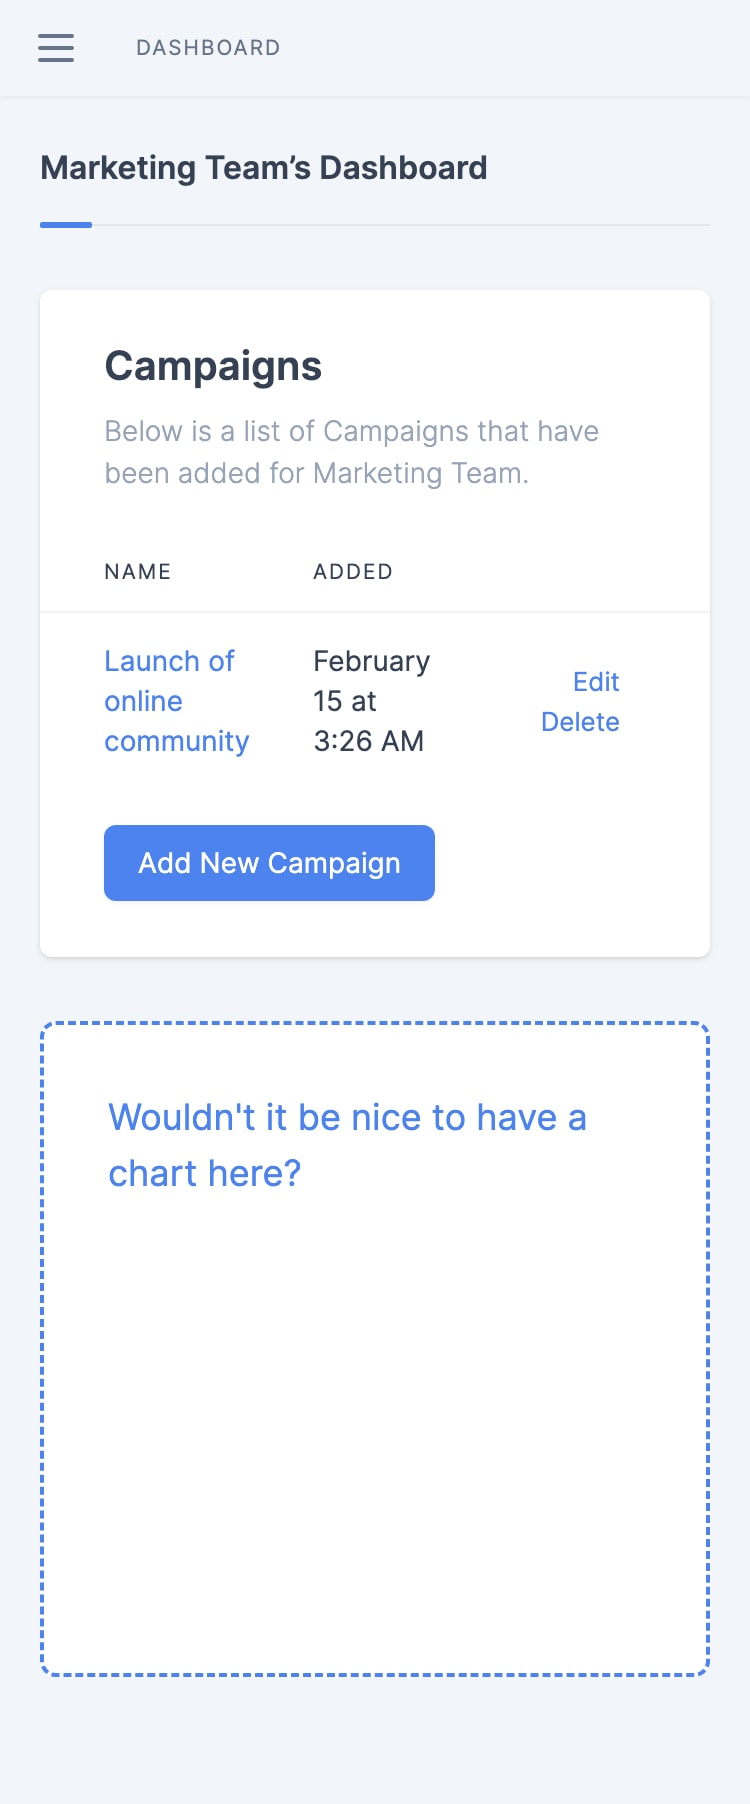
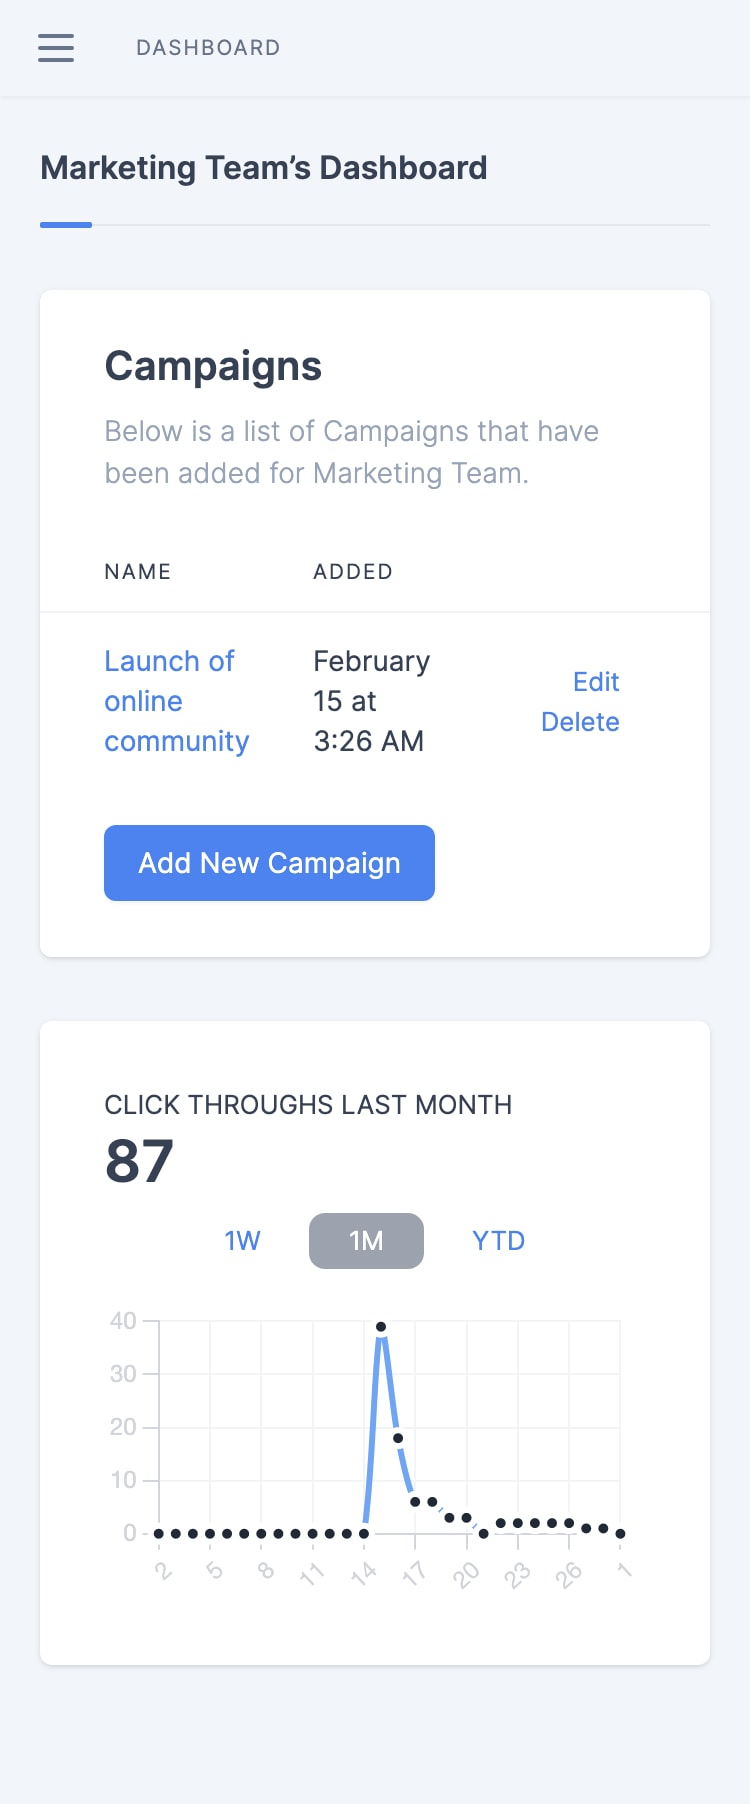
Imagine you’re building your app on the Bullet Train starter kit and thinking…
“Wouldn’t it be nice to add a chart right here”.

And then running this super-scaffold command in the terminal:
$ bin/super-scaffold supercharts:chart ClickThrough Team
And having a chart of “Click Throughs Per Day” appear in your app. Plop!

Introducing…
Supercharts
Add charts to a Bullet Train Rails app…
The same way you super-scaffold a resource.
Because you’re too busy to learn the chart part.
Start here:
How It Works
$ bin/super-scaffold supercharts:chart ClickThrough Team
That super-scaffold command comes from Bullet Train, the Ruby on Rails starter kit, and it has some smarts:
- It sees that there’s a model called ClickThrough
- It builds a controller called click_throughs/click_throughs_chart.rb, with a
#showaction - It makes that available at a route, and injects a
turbo_framein the right spot on thatTeamdashboard (you can move it around) - That
turbo_frameis mostly erb, with a chart.js chart wrapped in a special Stimulus controller with extra smarts - All the text you see is from the erb, deduced from that “ClickThrough” model name passed at the top
Exclusively for Bullet Train
Bullet Train is a Ruby on Rails starter kit by Andrew Culver.
Check it out if:
- you’re starting a new business idea, or
- if you’re building an on-the-side app to do something separate from your main business (e.g. an analytics app)
That super-scaffold command comes from Bullet Train, and it lets you build whole CRUD UIs really quickly. It’s really not your standard Rails scaffolding.
Supercharts is a third-party Bullet Train plugin that uses that same super-scaffolding approach under the hood.
What’s great is that it builds on Bullet Train’s solid foundation:
- It’s Hotwire. The charts are in a
turbo_frameat a URL, with chart.js wrapped in a Stimulus controller. No JSON endpoints needed. - It’s as little JavaScript as possible. More of the stuff is in erb.
- It uses TailwindCSS for the Custom CSS Properties
- It uses CanCanCan for authorization.
- It’s made for light mode/dark mode and repaints on switch
- It’s responsive and intuitive on mobile when your thumb is in the way
“Okay, take me to the project on GitHub”. There you will find installation instructions, a full example on how to use Supercharts, and a list of ways to modify the chart.
By default, it’s per day, but you can change that.
Click Throughs per day is the default. But let’s see a few other examples:
- Properties sold per day ⏭ You’d change from grouping on
created_atto grouping onsold_at. Then tweak the generated text to add the word “sold”. - Cumulative total downloads per day ⏭ Run a separate query to
COUNT()your Download model before the current period, and before you generate the CSV, run a loop on your per day counts and tally a running total.
For more of the under the hood smarts, see the groupdate gem by Andrew Kane, which powers Supercharts.
A pretty chart, without learning what makes a chart pretty
I’ve made Supercharts for those of you who want a pretty chart but are too busy with other stuff to get into the headspace of learning how a chart is put together.
It’s omakase. “I leave the choices up to you”.
- You don’t have to learn the chart.js configurations. The Stimulus controller does that for you. But if you’d like to make some small tweaks, you can do so right in the
erb - You don’t have to learn about the performance aspects of generating the chart. The
turbo_frameis lazy-loaded, and before it loads it’s going to show a temporary placeholder with the right height. When the query is done loading (it’s actually pretty fast), the chart loads. - You don’t have to learn how to best display a chart on mobile. Supercharts has some opinionated takes on a mobile version of your chart. The thumb will block your chart, but the text summary will show right above.
- You don’t have to learn how to make the chart accessible. We do a minimum first pass at that aspect.
- You don’t have to learn how to make the chart update on light mode/dark mode change. That’s part of the package.
For you, the hard part is the chart part?
Alongside Supercharts, I offer my services over at customcharts.dev. Useful if you’ve got a big project going but your team is too small for the charting expertise.
Also useful if there’s a custom chart you need that’s different from Supercharts.
Speaking of different charts…
Supercharts has one free chart for now, maybe more PRO charts in the future?
I’m thinking there might be some new charts and some nice extras I can bundle into a PRO tier. We’ll see?
If you want to stay in the loop, here’s an announcements-only email list. On sign up, I’ll ask you if there’s a particular chart you’d like to see developed, but otherwise, I’ll only send you emails on new developments.
One last thing…
A Bullet Train theme made for Supercharts
Transmission is a new theme for Bullet Train that’s made for Supercharts. It’s now in pre-order, and it’s going to be available in the first months of 2023.


